Geological maps are so colourful! |
Have you ever looked at the landscape around you and wondered about the rocks? How old are they? What are they made of? On this page, you’ll find a package of information (text & video resources) with all of the interesting facts about our province’s colourful geology! Scroll down to the bottom of the page to find a series of simple and fun activities for home or classroom learning.
The Geology of British Columbia |
The image below shows a geologic map of British Columbia. Right now, it may look like a colourful combination shapes and lines that have little or no meaning to you. The information here will give you an overview of the language, uses, and creation of geologic maps.

Click on this map to open a ZOOMABLE version.
Geologic Maps FAQs |
Geologic maps are to a geologist what blueprints are to an architect or what a road map is to a traveler. Just like all maps, geologic maps show where things are. The maps you use most often probably show the location of places that include streets, buildings, streams, and lakes.

An overview map of Metro Vancouver and Greater Vancouver.
Unlike these maps, a geologic map shows the distribution, type, age, and relationships between rocks that make up Earth’s surface. Geologic maps present three-dimensional features on a flat piece of paper, with the added benefit of depicting the relative age, composition, and relationships between rocks and sediments at or near Earth’s surface. A geologic map tells the geologic story of a given area, by showing the type of rock or sediment on which you are standing; where similar rocks or sediments may be found; how old the rocks or sediments are; what they are composed of; how they formed; how they have been changed by faulting, folding, or other geologic processes; and what existing or potential mineral resources and geologic hazards are nearby.
Geologists make geologic maps by hiking around a specific area, marking the location of geologic contacts, faults, folds, and other features on a topographic base map. Once the fieldwork component is completed, geologists spend time in the office digitizing their field maps and field data. Compiling a geologic map is a bit like putting together a puzzle that is missing a several pieces. There is no picture to refer to when putting the puzzle together, so geologists have to make interpretations based on their field observations about the “missing puzzle pieces”
As a geologist becomes familiar with the rocks and their distribution in a particular area, he/she will start to piece together the three-dimensional picture of the geology (i.e. how do the rocks look below Earth’s surface—what we can’t see from the ground). As the geologist fits together the various pieces of the puzzle, they eventually come up with a coherent picture of the geologic landscape. This picture is the geologic map. The map will reveal the geologic history of the area—for example: have the rocks been folded or faulted? Was this area under water for a significant period of time? What are the geologic hazards in the area? What and where are the natural resources?
This imaginary puzzle, the geologic map (our “picture” of the landscape) is nearly always incomplete, because rocks are never completely exposed or may have been eroded away. In either case, the geologist must interpret the rock record that remains, making an educated guess as to the true distribution and relationships among rocks and sediments. While many pieces of the puzzle may be missing, geologic maps provide our best window into the landscape’s history.
The first step to reading a geologic map is to look for the map key. This will be a table or list that explains any colors and symbols used to represent geologic features on the map. The map key lists geologic rock units from youngest to oldest. Each rock unit will have a name, an age, and a short description of its features.
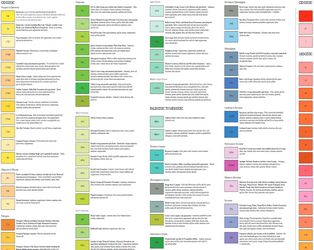
Click on the image above to open the full map key for B.C. geology.
By tracing map units across the countryside, geologists can locate earthquake faults, folds, and other geologic structures. Each map unit is also identified by a unique symbol. The first letter of these symbols is capitalized and denotes the age of the unit, while subsequent lower-case letters identify the name of the map unit.
The map key also includes any lines and symbols that appear on the map. A line may show where two rock units meet on Earth’s surface. Symbols can indicate a variety of information from the location of precious metals, fossils, and folded or faulted rock units, to the bedding orientation of a rock unit. A T-shaped symbol, called a “strike and dip” symbol, shows the orientation of a rock unit in 3-dimensional space. The long edge of the T indicates the “strike”, which is a line that represents the intersection of the rock layer with a horizontal plane. The small part of the T represents the dip direction and the number listed next to the symbol is the dip magnitude and indicate the angle of the rock layer down from horizontal. This number will be between 0-90º, where 0º represents a horizontal rock layer and 90º would indicate a vertically tilted rock layer.
Each color on the map represents a unique map unit or a group of rocks or sediments sufficiently distinct in age, composition, or environment of deposition so as to be differentiated from all other map units.
There are different line weights shown on geologic maps---both thin and thick black lines. Thin black lines typically mark the boundary or contact between two different rock units on the map and thick black lines show features called faults, where the orientation and type of fault can be denoted through special line decorations (e.g. tiny triangles or squares).
Each map unit is also identified by a unique symbol. The first letter of these symbols is capitalized and denotes the age of the unit, while subsequent lower-case letters identify the name of the map unit. For example, the symbol TRBk is shorthand for the Triassic-age (TR) Brooklyn Formation (Bk) a sequence of conglomerate, limestone, and minor volcanics deposited about 240 million years ago.
The pink patches represent a certain type of rock. Watch the video below to find out which one!
There were volcanoes along the edge of British Columbia? |
Did you know that British Columbia has a long history of volcanoes along its western edge? Watch the video below to learn more!
The light blue areas on the map represent something that is not a rock! Watch the video to find out what it is.
What is British Columbia’s geologic story |
How did British Columbia come to be? Why is our province the shape it is? Why is there land here instead of ocean? Watch the video below to find out!
Fun geologic map activities |
We’ve created a series of learning activities for you to explore more about the geology of British Columbia in your classroom or home. Click, download (& print) the worksheets below.